*A research plan for a modular LLM pipeline that reads global evidence, maps the systems countries depend on, and turns weak signals into an auditable risk state institutions can actually price.*
**Summary:** An evidence-bound architecture that goes past keyword-counting GPR. Small parsers extract claims, domain councils interpret them, and a quant layer fuses anchor stress, country exposure, and propagation into a risk state hedge funds and analysts can audit end to end.
**Status:** active · **Year:** 2026, research plan **Tags:** LLM Pipeline, Geopolitics, Intelligence Monitoring, Agentic Intelligence, Quant Research, Data Product
--- I started this project planning to build a better LLM reader on top of the Caldara and Iacoviello GPR index, the clean public baseline for measuring geopolitics through newspaper text. The more I worked through it, the more the project changed shape. The interesting question turned out to be what kind of instability such an index should measure in the first place, and whether a modular agentic system could produce a data stream good enough that the institutions already paying for fragmented geopolitical intelligence would prefer to buy this one instead.
The goal is to build a better measurement system, and to sell the data stream that comes out of it. — Core thesis
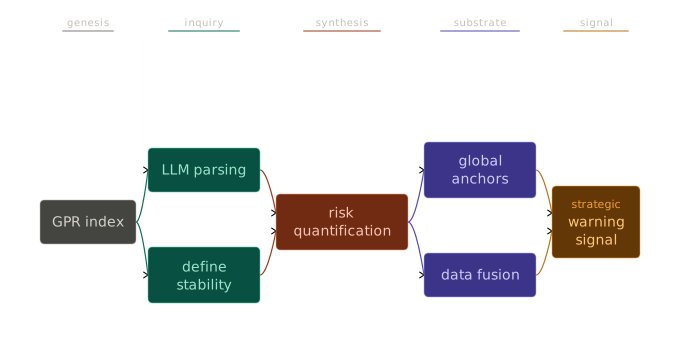 *RESEARCH PATH — The research path runs from the GPR index through LLM parsing, a working definition of stability, a global anchor map, and data fusion, ending in a strategic warning signal.*
A short primer first. The Caldara and Iacoviello Geopolitical Risk index, built by two Federal Reserve economists, measures geopolitical risk by counting the share of newspaper articles that use a fixed vocabulary tied to wars, terrorism, military threats, and international tensions. The Recent index reads ten major English-language newspapers from 1985 onward, and the Historical index reads three papers back to 1900. In each month the index is the share of articles that match the risk vocabulary, rebased so the 1985 to 2019 average equals 100. The big spikes line up with the world wars, the Cuban Missile Crisis, 9/11, the Iraq wars, and Russia's invasion of Ukraine.
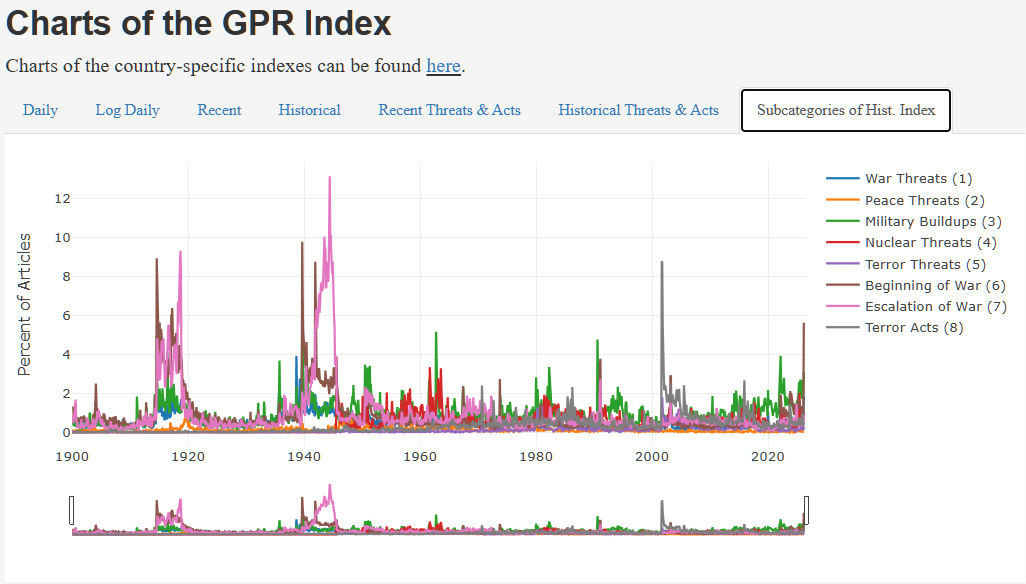 *BASELINE · SOURCE — Subcategories of the historical GPR index from matteoiacoviello.com, covering war threats, peace threats, military buildups, nuclear threats, terror threats, beginning of war, escalation of war, and terror acts from 1900 to the present. Source: Caldara and Iacoviello (2022), Measuring Geopolitical Risk, American Economic Review.*
The value of this index is that it created a long, stable, public time series and made geopolitics measurable using newspaper text as a proxy. The cost of the method is that counting risk language inside a fixed source set ignores who the actors are, how trustworthy each source is, which countries are actually exposed, what markets are doing at the same time, and which underlying systems are being stressed.
GPR is the strong pre-LLM baseline. The opportunity is to build the post-LLM successor, designed from day one as an intelligence monitoring product rather than an academic time series.
**Pipeline:**
1. **GPR** (input) — frequency of risk language 2. **Evidence** (process) — parser layer 3. **Anchor** (process) — stress model 4. **Auditable** (output) — risk state
The shift: from counting risk words to reconstructing what happened, who moved, which load-bearing system was stressed, and who is exposed.
A small model can read a chunk of news and extract the actor, the target, the action, the location, the domain, the severity, and the uncertainty, then attach the exact source span that supports each claim. That is the useful role for most LLMs in this system, parsing narrow evidence well while leaving global judgment to the aggregation layer above them.
The LLM is one instrument inside the measurement system, never the index itself.
Cheap Gemma class parsers do the volume work, original language storage prevents translation drift, evidence spans keep every claim auditable, and deduplication kills wire-copy double counting before any score is computed. Stronger model councils only enter the loop where actual judgment is needed.
A better parser does not solve the core problem. To quantify geopolitical risk I first need a working definition of the thing being measured. Stability cannot mean that nothing bad happens, because stable systems still absorb wars, sanctions, pandemics, recessions, and supply shocks without losing core function. A stable system is one that takes shocks and keeps running.
```math \text{stability} \;\equiv\; \text{shock absorption capacity} ``` *Instability then becomes degradation of that capacity, rather than a count of bad events.*
Instability is stress on the systems that let normal life, trade, finance, and state capacity continue.
Once stability is defined as absorption capacity, the next question is what does the absorbing in practice. The answer is a finite set of load-bearing systems: trade routes, energy flows, food systems, credit markets, dollar plumbing, data cables, alliances, demographics, public health, and critical mineral supply chains. A geopolitical event matters more when it stresses an anchor that many countries depend on, and matters less when it stresses an anchor with little exposure.
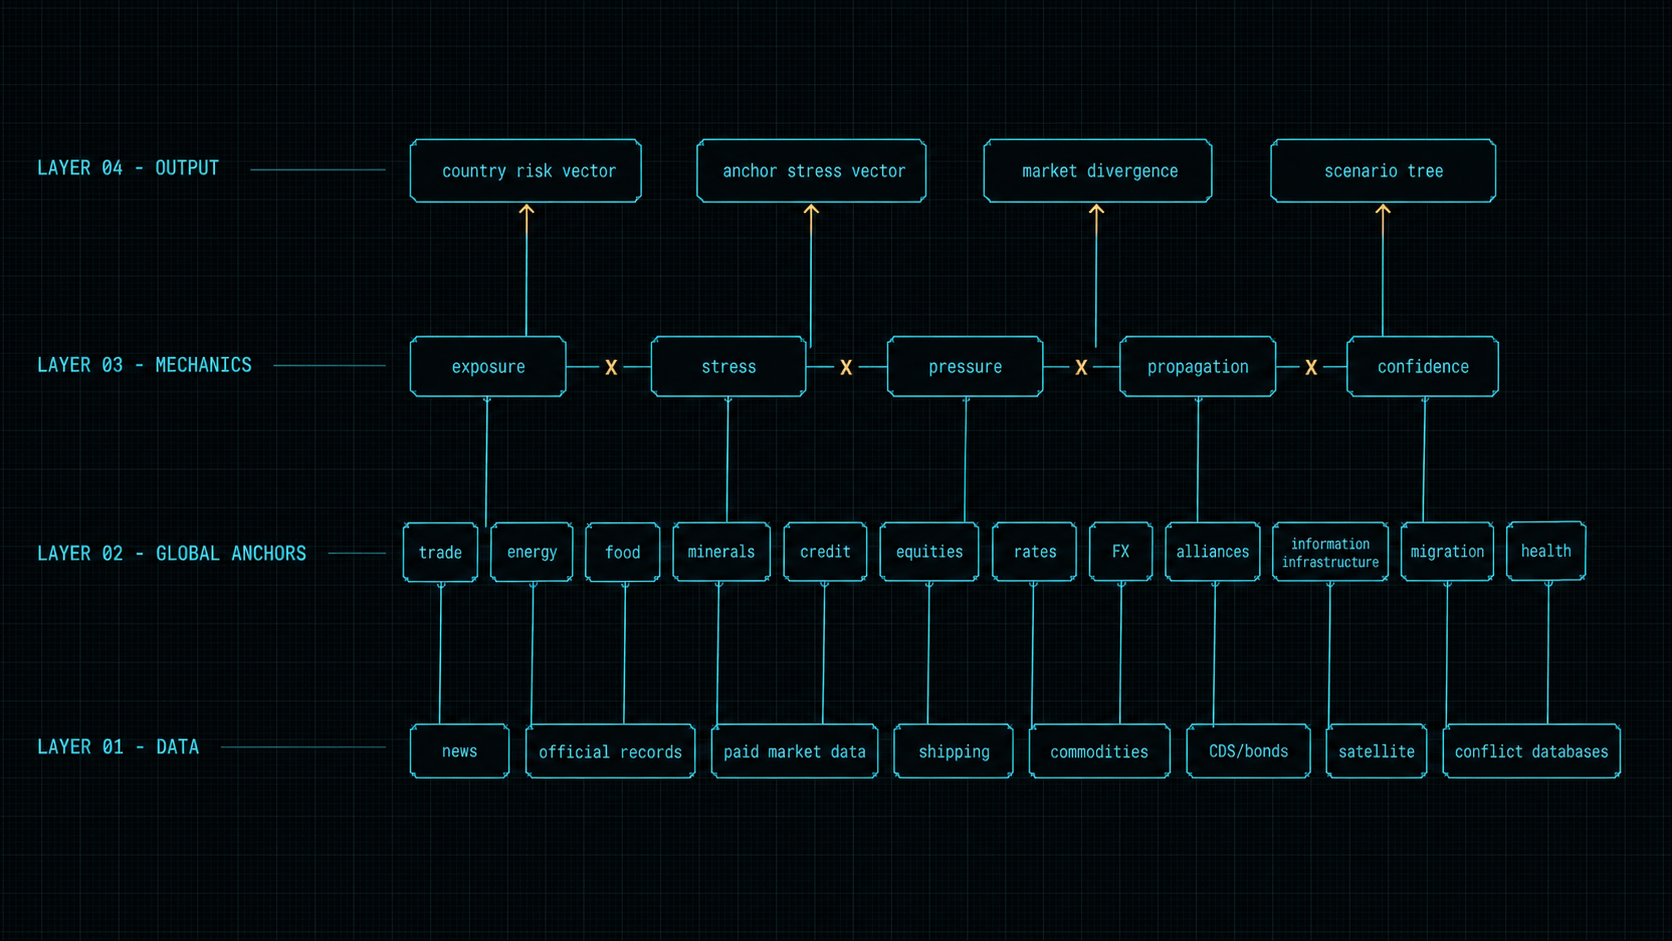 *STACK — The index sits on a layered measurement stack where raw data feeds global anchors, anchors feed the mechanics of exposure, stress, and propagation, and those mechanics feed the output vectors institutions actually consume.*
The research task is to find the few streams in each domain that actually measure fragility, the ones a serious analyst would trade on if they could get them cleanly.
A serious index cannot run on randomly scraped news. The source layer has to be historically verifiable, versioned, and ranked by domain, because some sources are useful for facts while others mostly reveal how a state wants to be seen. Paid datasets matter because they compress expert activity into prices, flows, spreads, and claims, which are exactly the things institutions already pay heavily for in a fragmented form.
```math \text{source}_{\text{score}} = \text{history} + \text{authority}_{\text{domain}} + \text{latency} + \text{bias} + \text{backtest} ``` *Every source carries a per-domain authority weight, learned from historical event panels rather than assumed.*
The system should be modular because crises are modular before they become global. Energy, food, shipping, credit, FX, equities, military posture, alliances, and information infrastructure each have their own mechanics and their own experts. A small parser creates the underlying claims, and domain councils interpret those claims inside the correct field. Councils share signals with each other because real crises cross domain boundaries.
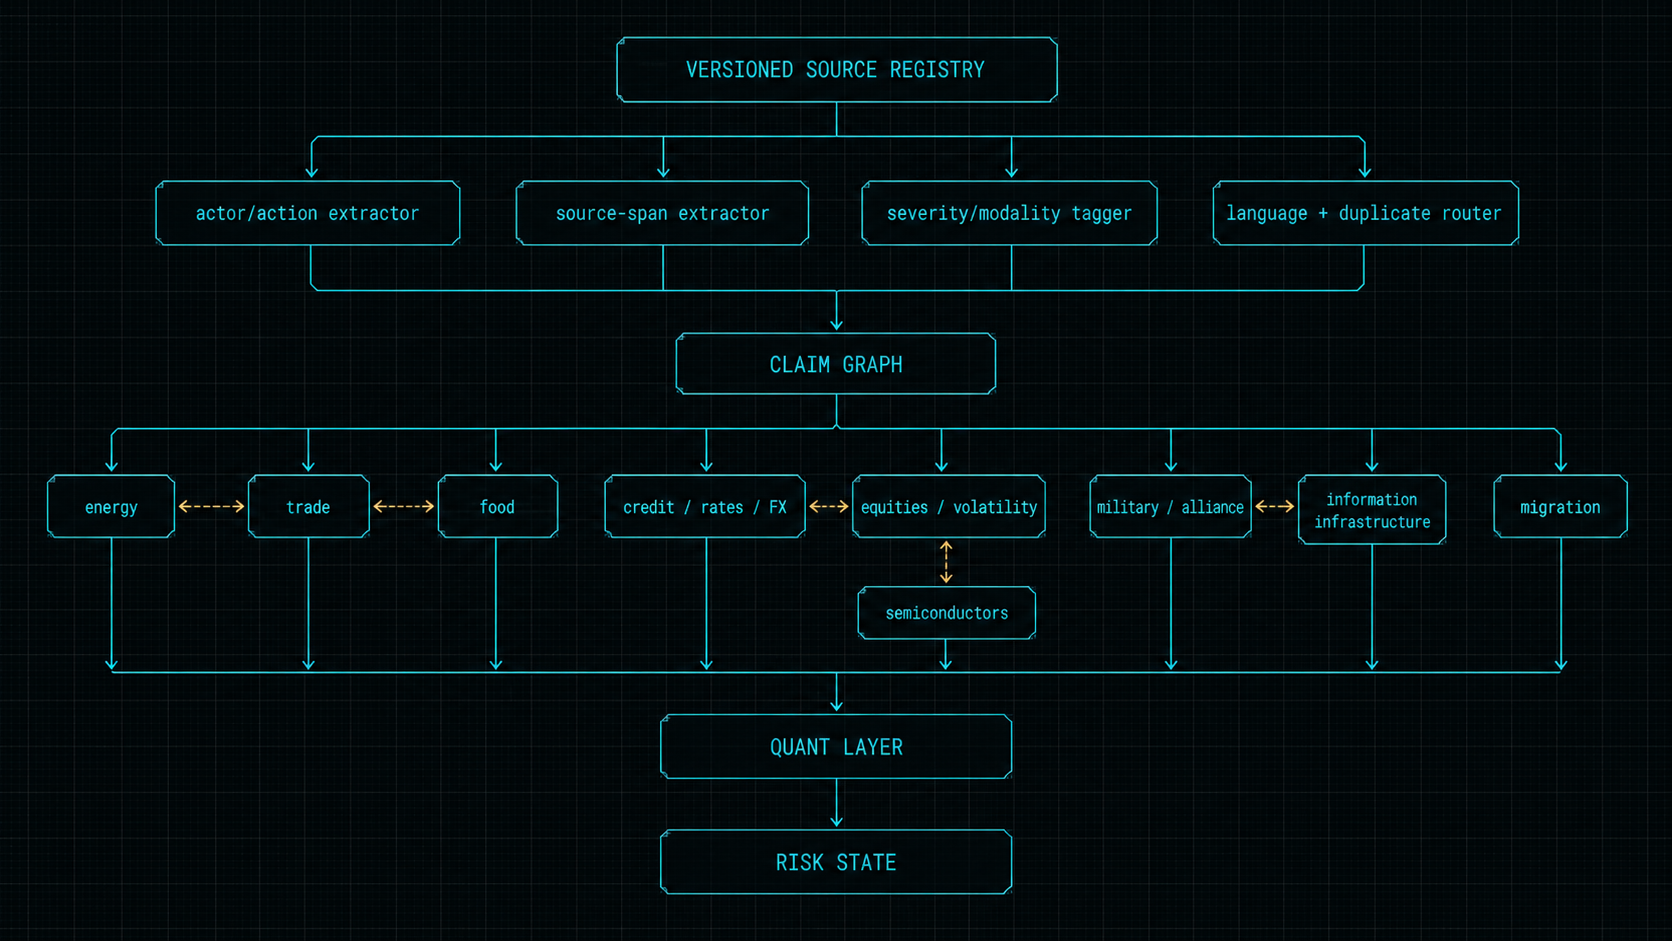 *ARCHITECTURE — The agentic pipeline routes small parsers into a claim graph, lets domain councils interpret claims inside their own field, hands the result to a quant layer for aggregation, and keeps an audit layer underneath so every output stays reproducible.*
The hard part of the project is deciding how much each signal should matter when they are combined. A hundred routine headlines should not drown out one credible tail event, a dramatic event should not move the score for a country with no exposure to the relevant anchor, and markets should inform the index without becoming its ground truth, otherwise the index just repeats market-implied risk in a different form.
```math \text{risk}(c, a, h) \;=\; \underbrace{\text{exposure}(c, a)}_{\text{who carries it}} \cdot \underbrace{\text{stress}(a, h)}_{\text{anchor pressure}} \cdot \underbrace{\text{event}(e)}_{\text{what happened}} \cdot \underbrace{\text{prop}(c)}_{\text{network}} \cdot \underbrace{\text{conf}(\mathcal{E})}_{\text{evidence}} ``` *Country c, anchor a, horizon h. The decomposition is conceptual, and the real work is calibrating each term against historical event panels.*
**Future work:**
A single headline score is only useful when the diagnostics behind it are exposed. The valuable object is a structured risk state that an analyst can query for what changed, why it changed, which sources moved it, which anchor was stressed, which countries are exposed, and whether the signal is genuinely new or already priced into markets. That last column is the whole game for a hedge fund.
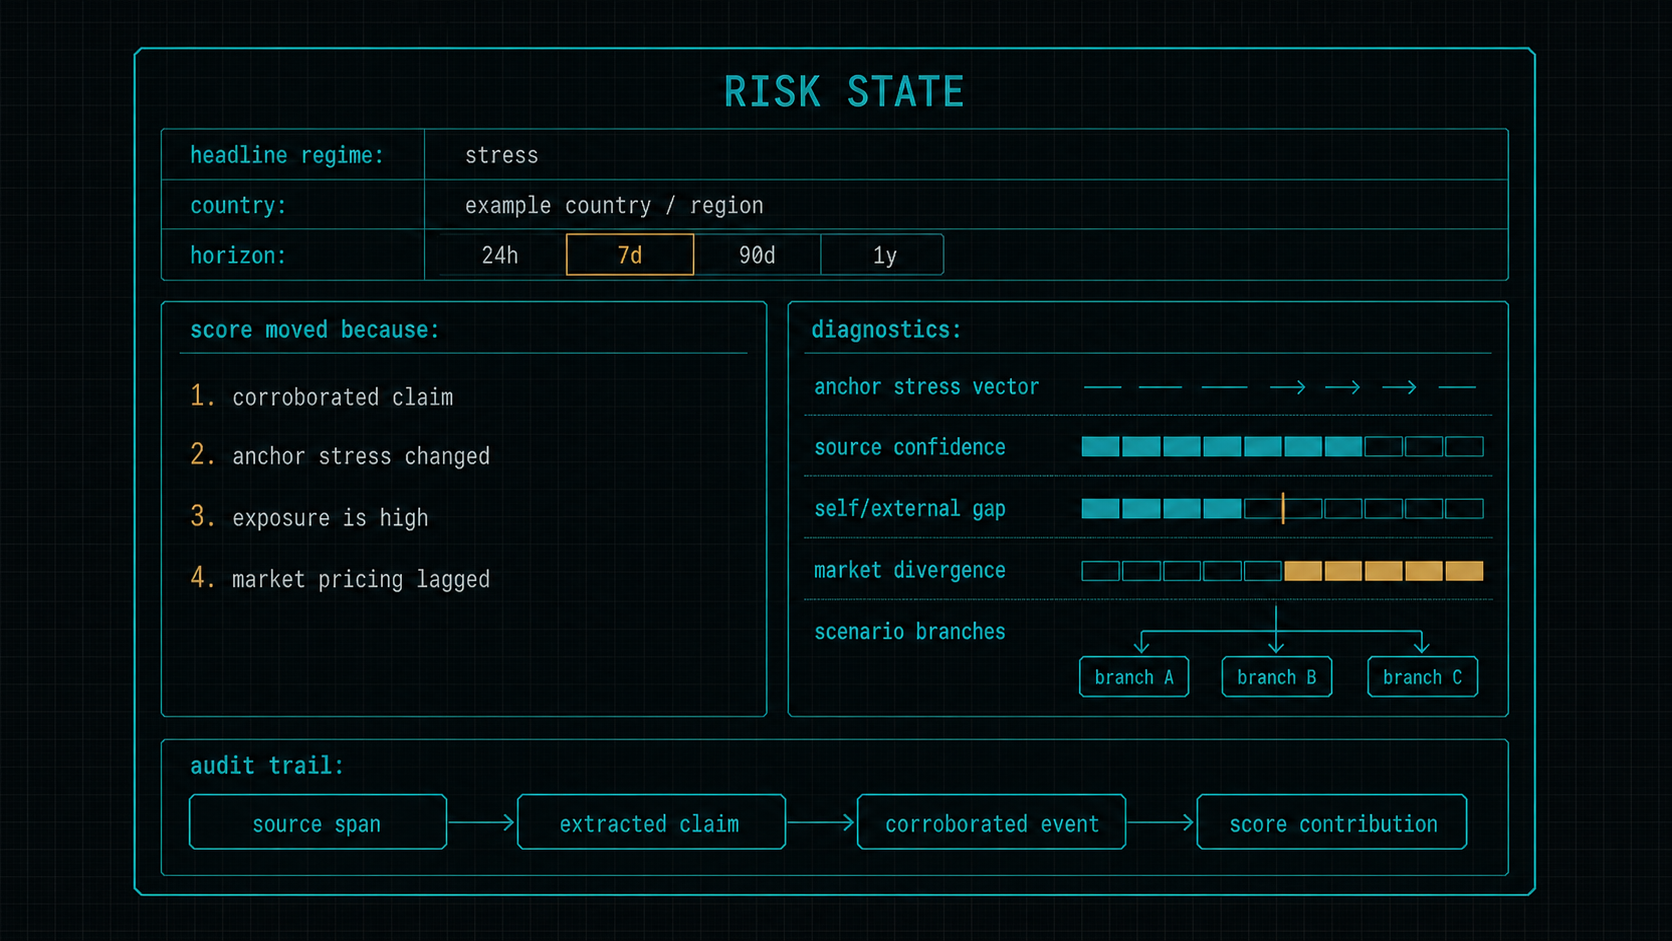 *DATA PRODUCT — The risk-state object packages the headline regime, country vector, anchor stress, NLP-implied minus market-implied risk, scenario tree, audit trail, and confidence bands into a single structured record. That record is the unit of sale.*
The motivation for the project is direct. Hedge funds, sovereign desks, reinsurers, supply-chain teams, and policy institutions already pay heavily for geopolitical intelligence, and most of what they buy is fragmented, opaque, or recycled news with a logo on top. A pipeline built around evidence, exposure, and audit can produce a stream that is measurably better in three ways at once: earlier than the alternatives, more diagnostic about what is actually moving, and harder to fake because every claim is tied to its source span.
That stream is the asset. The index is just its public face.
The project cannot start with a dashboard, it has to start with research. The first step is to map the anchors and the data sources that measure them. The second step is to build the pipeline that turns those sources into structured evidence. Only after both of those exist does the quant work make sense, because the scoring function depends on knowing what each stream actually measures.
| Phase | Focus | Deliverable | | --- | --- | --- | | 01 · Map the system | Anchors, sources, exposures, cascades | Domain map and historical event panel | | 02 · Evidence pipeline | Parsers, claim schema, dedup, councils | Multilingual claim graph | | 03 · Quantify and validate | Aggregation, severity, propagation, calibration | Backtested risk-state API |
*Each phase has to produce an artifact a serious analyst would actually inspect, never a slide deck.*
I do not think geopolitical risk can be reduced to a clean closed-form formula. The measurement system around it can be much better than what exists today, by preserving evidence end to end, separating different source perspectives, modelling country exposure properly, learning from markets without copying them, and staying modular as AI capability improves. The research question I want to answer is whether a pipeline built on those principles can detect stress earlier, explain it more clearly, and produce a signal that serious analysts would trust enough to pay for.
That is the index I want to build.
**Tools:** Small Gemma-class parsers · Stronger council models · Claim graph (Postgres + pgvector) · Source registry with versioning · Historical event panels (ACLED, GDELT, UCDP) · Market data (CDS, FX, rates, equities, vol) · Shipping AIS & freight · Backtesting harness · Drift & calibration monitor