*An interactive 3D map of all 12 running DMRC lines - built from a network with no public elevation profile, with uncertainty kept honest.*
**Summary:** DMRC publishes the network without heights. I rebuilt the third dimension from five confirmed rail anchors, terrain DEM, structure-type priors, and PCHIP interpolation - and put the confidence on screen.
**Status:** active · **Year:** 2026 **Tags:** 3D Visualization, Data Engineering, deck.gl, Geospatial, React
---
Best experience on PC
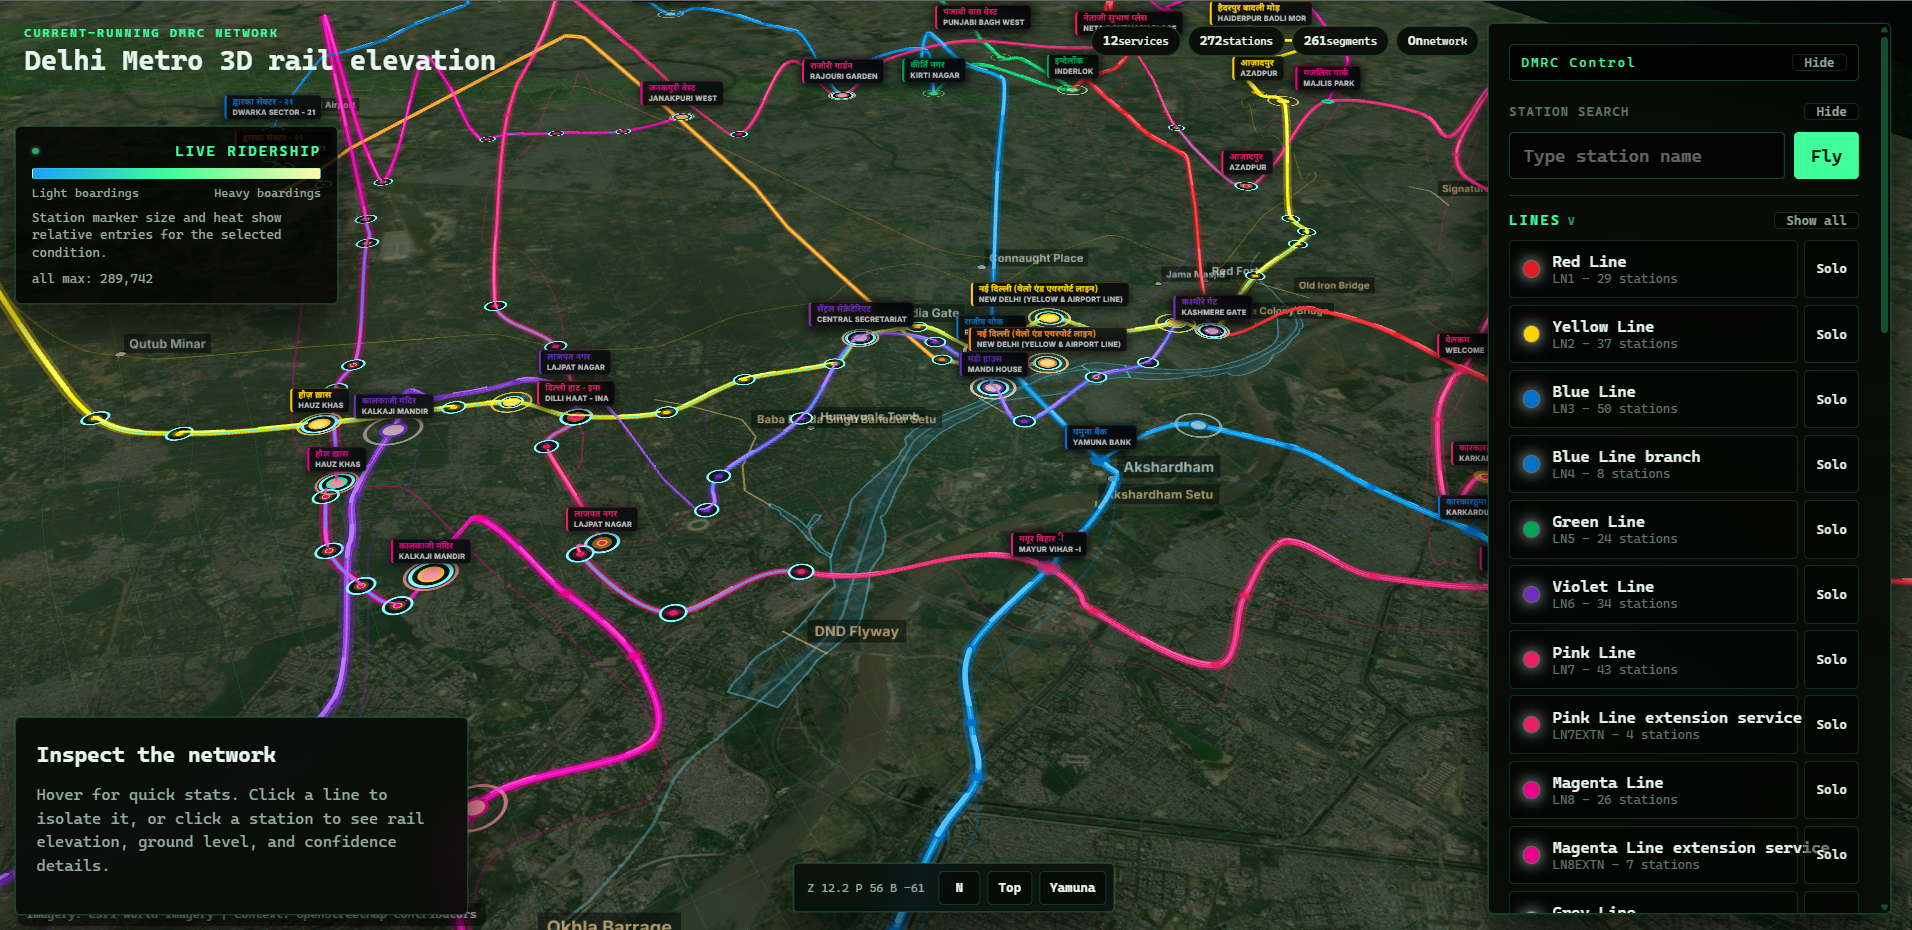 *APP · LIVE VIEW — All 12 lines, 272 stations, rendered live with official DMRC colours. Ridership drives marker size and a heat tint at the busiest interchanges.*
DMRC doesn't publish rail elevation profiles. There is no public file with a continuous table of how high each track sits above sea level across the operating network. They publish a passenger map, a station REST API, and EIA documents for Phase III and Phase IV. None of it gives you usable rail height.
Ground elevation is a different thing - and it is available. Copernicus DEM GLO-90 (via Open-Meteo) gives you land surface height to about 90m resolution. But terrain is not track. An elevated viaduct sits roughly +10m above ground. A deep tunnel runs −16 to −45m below it. Knowing the ground tells you nothing about where the rail actually is. With only a handful of confirmed rail heights to work from, the third dimension had to be reconstructed end-to-end.
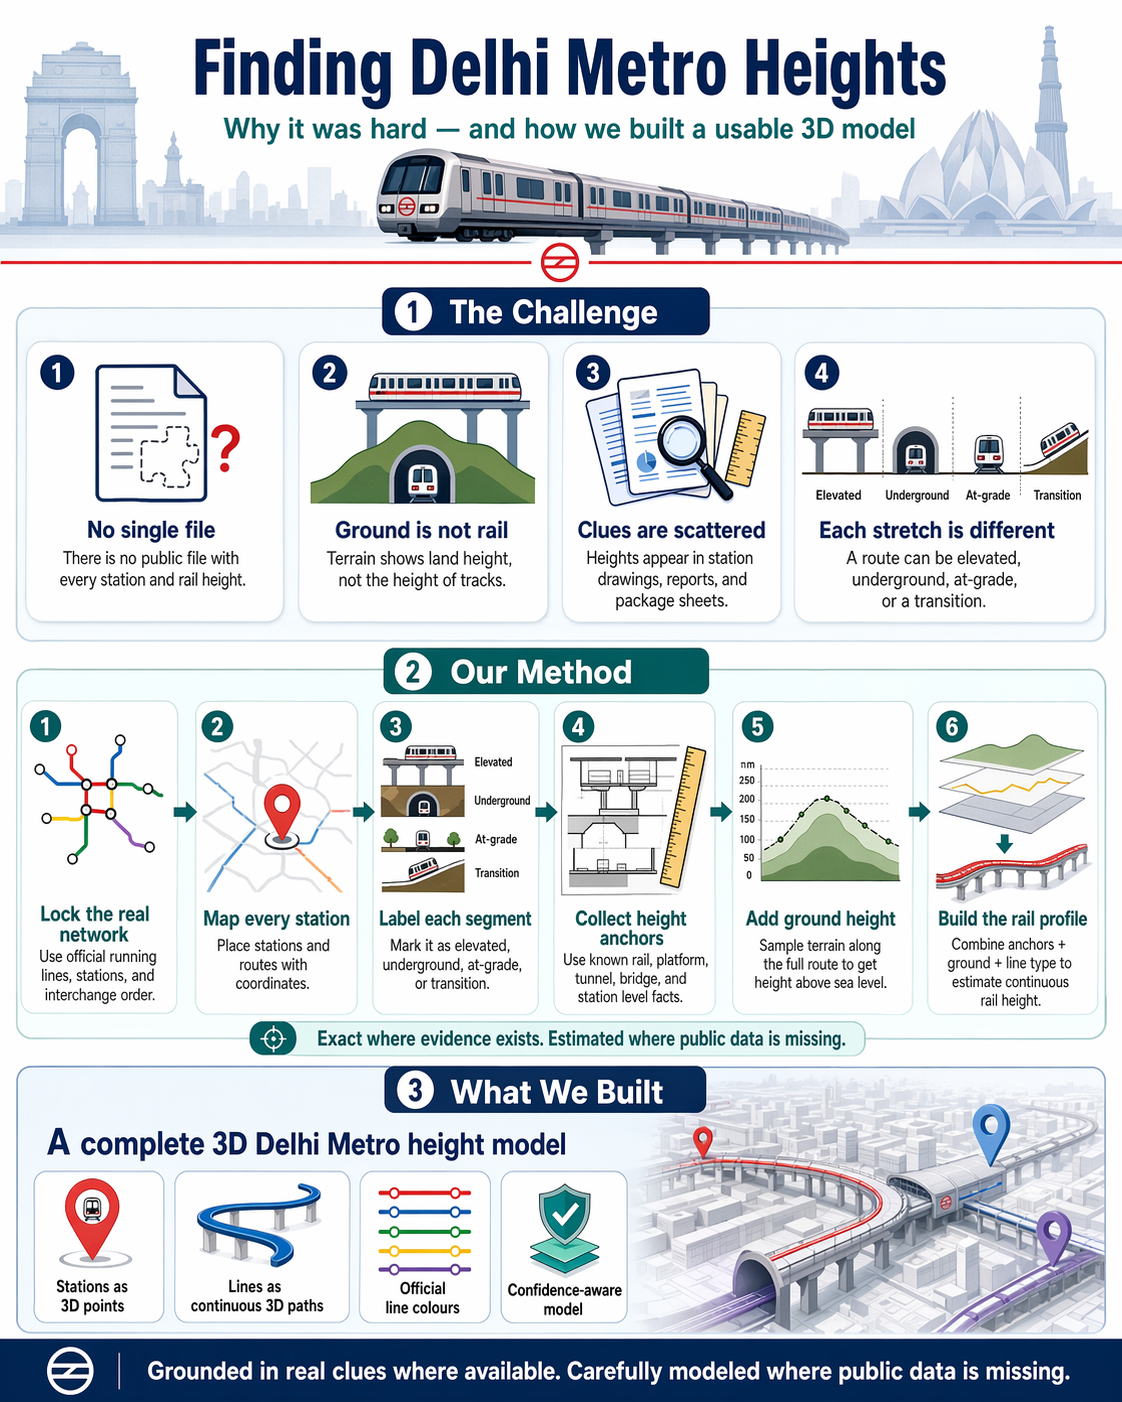 *OVERVIEW — The shape of the problem. Five confirmed anchors, one DEM, structure-type priors, PCHIP through the gaps - exact where evidence existed, estimated everywhere else with uncertainty bands to show it.*
Lock the operating network from official DMRC sources. Place every station with real coordinates. Label every segment as elevated, underground, at-grade, or transition. Pin the five confirmed rail heights. Sample terrain along the route every ~70m. Then build a continuous rail curve through the anchors using PCHIP interpolation, applying engineering offset priors per structure class. The anchors themselves are the only measured points in the model; everything else is inferred.
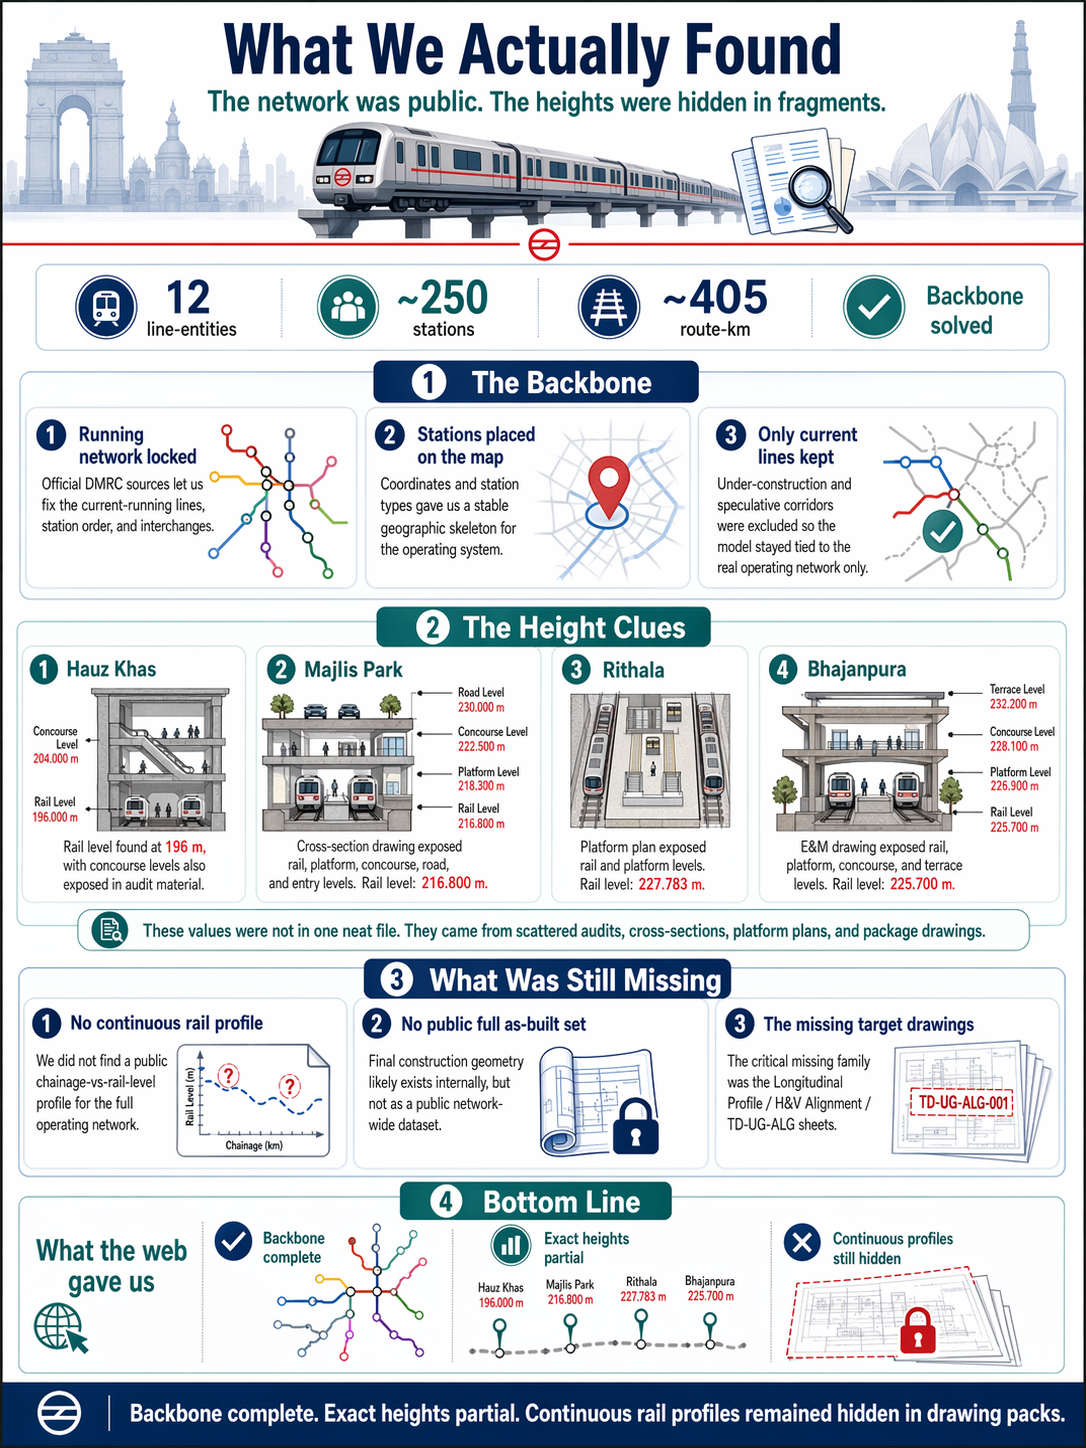 *GROUND TRUTH — The five anchors that hold the entire curve. Hauz Khas (196.0m), Majlis Park (216.8m), Rithala (227.783m), Bhajanpura (225.7m) from official drawings, plus one more from internal package documentation - the only ground truth across 272 stations.*
| Structure class | Best offset | Uncertainty band | | --- | --- | --- | | Generic elevated viaduct | +10 m | 8 – 14 m | | Phase IV elevated extension | +12 m | 8 – 20 m | | Double-decker corridor (Yamuna Vihar) | +18.5 m | 16 – 20 m | | Generic underground | −16 m | −12 to −22 m | | Deep Magenta line (Hauz Khas / CC27) | −24 m | −16 to −32 m | | Airport Express deep section | shaped | midpoint 40 – 45 m below | | At-grade | +0.5 m | −0.5 to +1.5 m |
*Priors derived from EIA cross-sections and corridor-specific depth references. PCHIP forces the curve through the five confirmed anchors exactly - they never get smoothed.*
Every render point carries three values: rail_msl_best (best estimate), rail_msl_min (lower bound), rail_msl_max (upper bound). A separate rail_msl_render field is the smoothed display curve - visual only. The actual data values are what you see when you hover a station in the app.
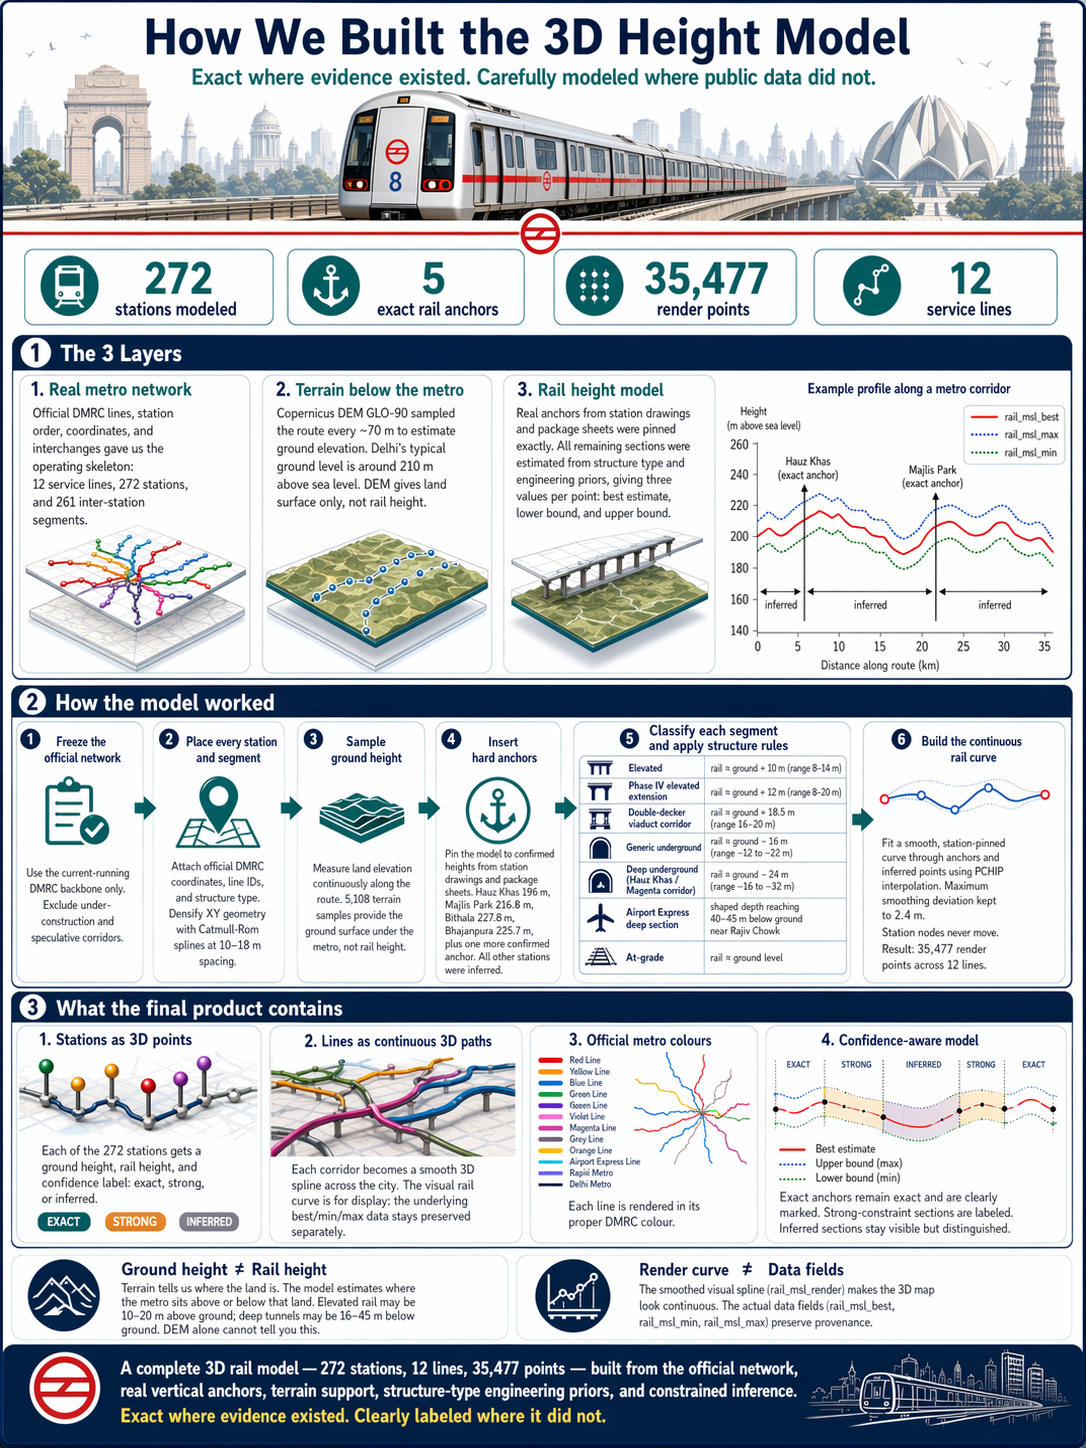 *ARCHITECTURE — Three layers stacked: the operating network, the terrain DEM beneath it, and the inferred rail-height model on top - with provenance preserved per point.*
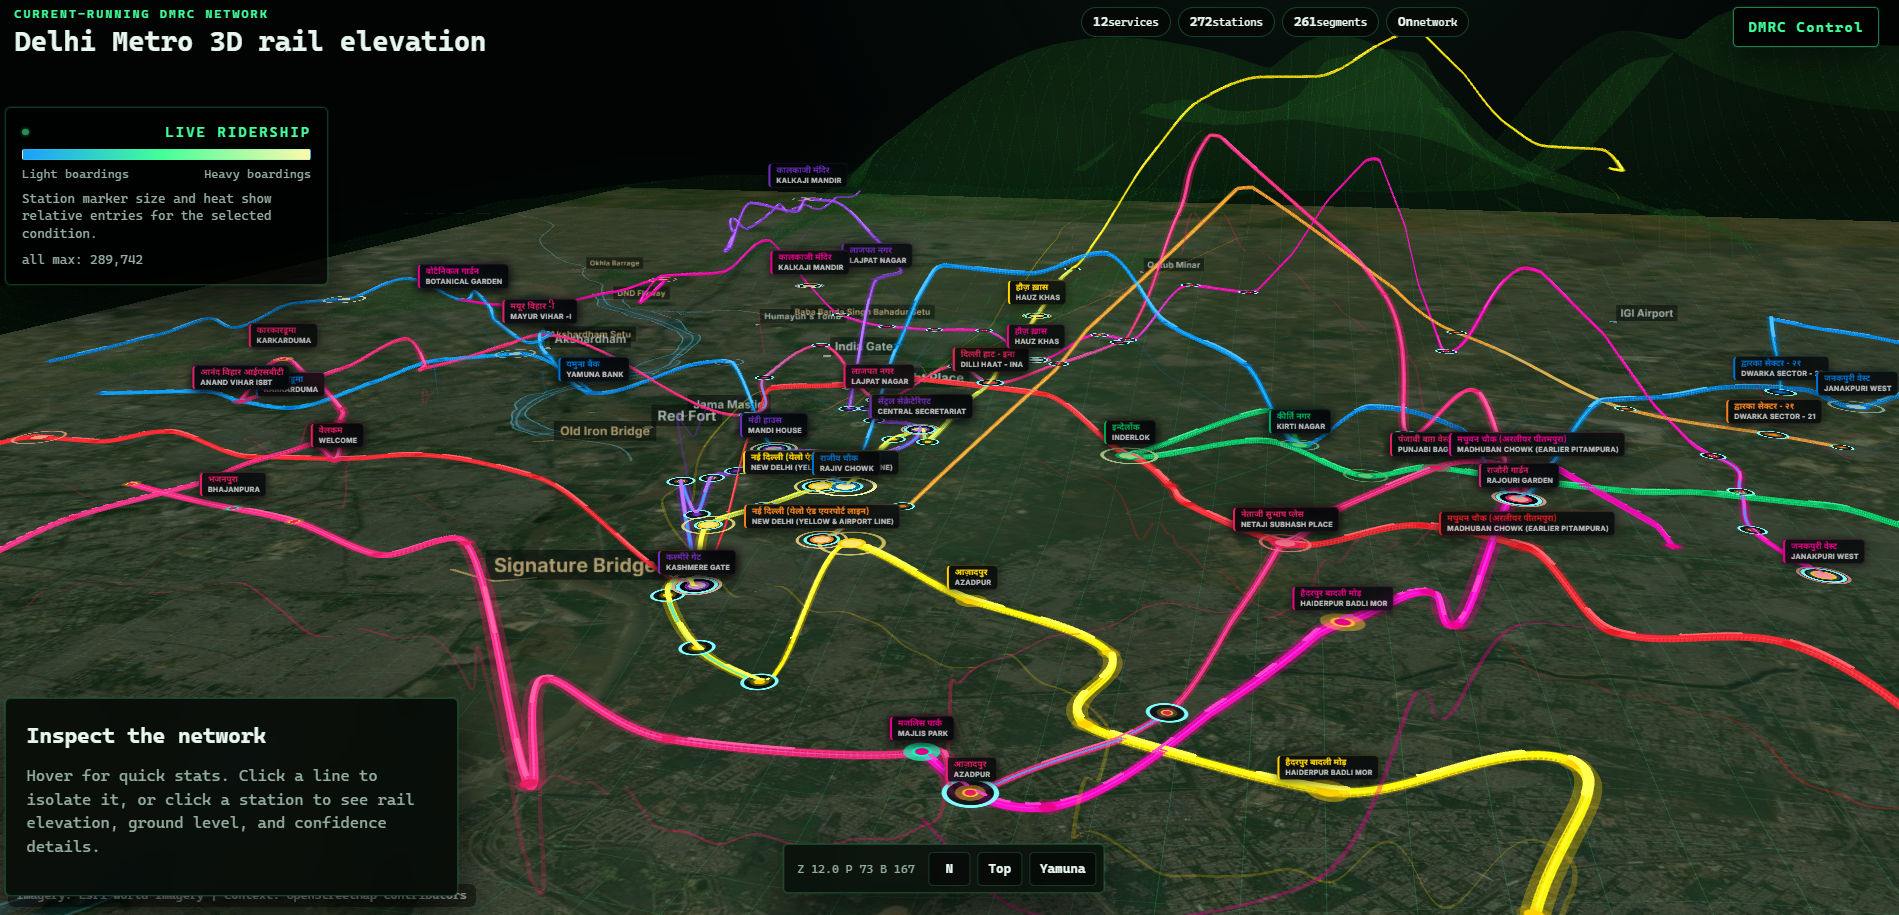 *APP · 3D MODE — Tilted view. Elevated sections climb visibly above the terrain ribbon; deep tunnels dip under it. Vertical exaggeration defaults to 70× - the slider goes 1× – 140×.*
Click a line in the panel and the rest dim out. Type a station name and the camera flies to it. Every state - basemap, exaggeration, soloed lines, confidence filter, vertical view - serializes into the URL hash, so any view you find is a link you can share.
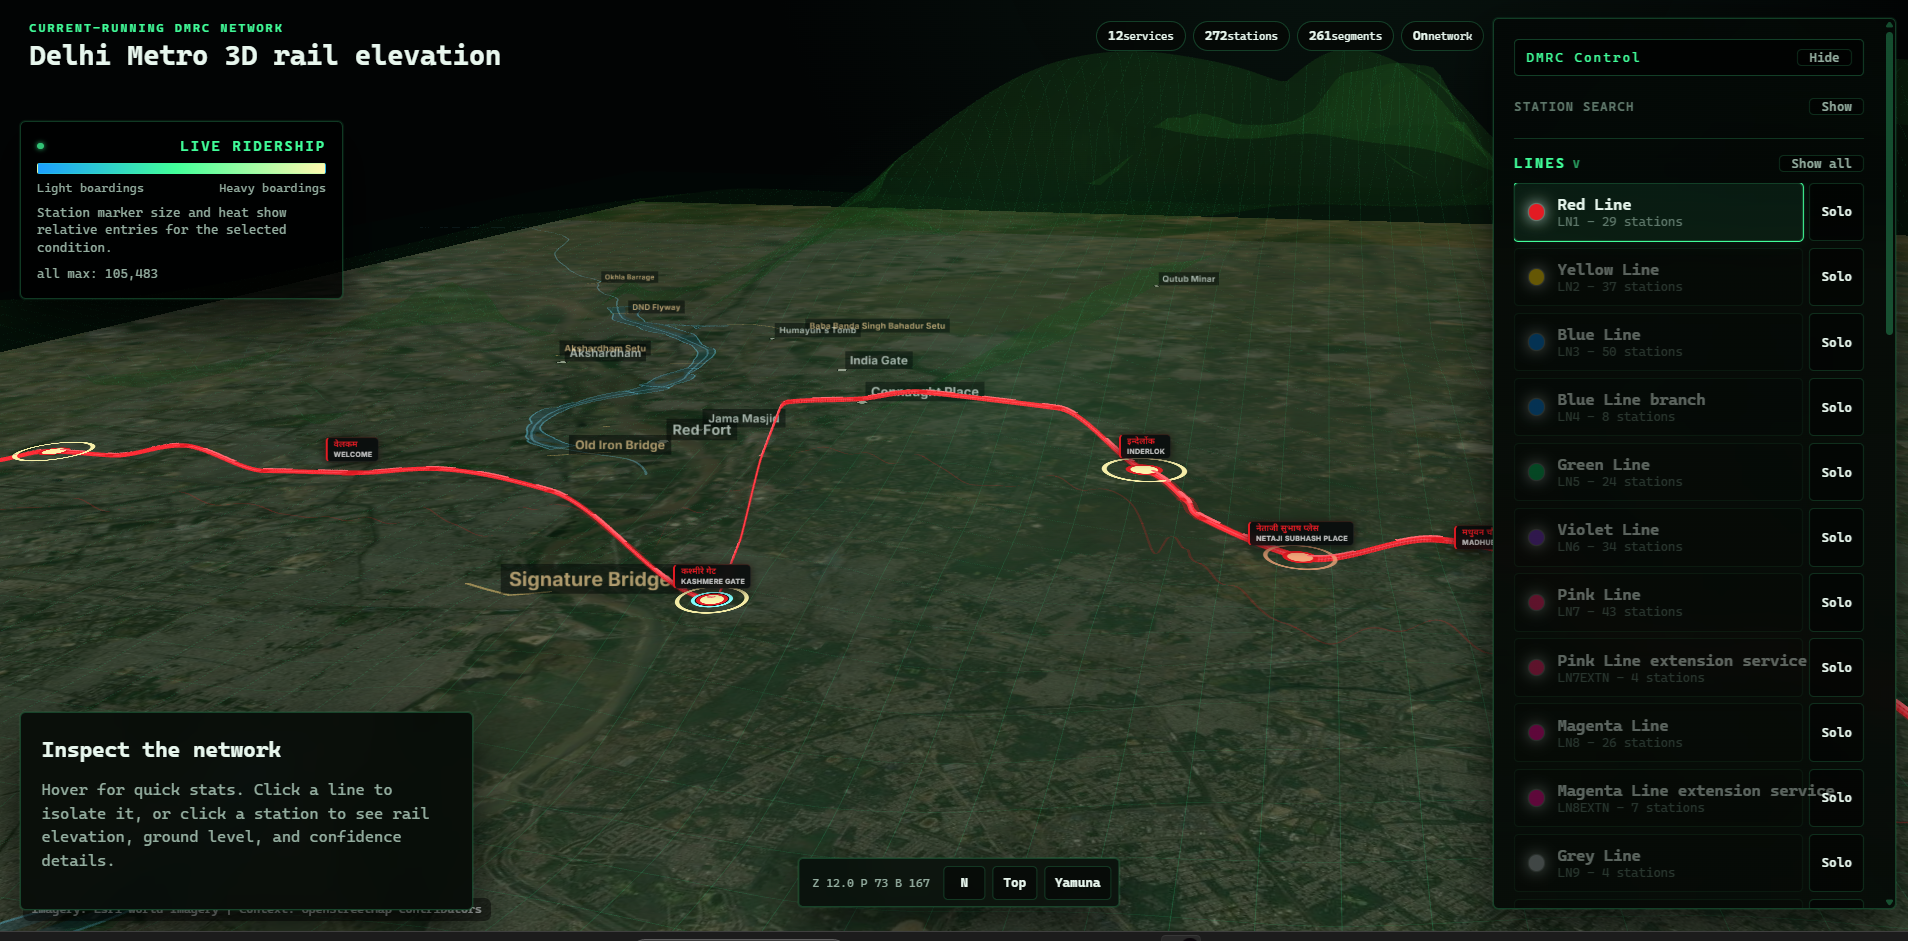 *APP · SOLO — Red Line in solo mode. The other lines fade so the height profile of a single corridor reads cleanly across the city.*
The map looks authoritative. For most of the network, it is an inference - and that needs to be visible on screen, not buried. Five out of 272 station heights are real. The rest come from terrain plus structure-type priors. Every station and segment carries a confidence label: exact, strong constrained, or weak constrained. The control panel can hide everything below a chosen confidence. Most of the network is weak_constrained. That is the honest answer.
Fully static once built. The Vite production output is a `dist/` folder you can drop on any CDN. No server, no database, no API key. Pre-computed render artifacts (GeoJSON + JSON + CSV) are loaded once at startup and the browser does the rest with deck.gl's PathLayer, ScatterplotLayer, TerrainLayer, and a custom 3D tube mesh.
**Tools:** React 19 · Vite 6 · deck.gl 9.1 · Copernicus DEM GLO-90 · Open-Meteo Elevation API · DMRC passenger REST API · PCHIP / Catmull-Rom interpolation · Esri World Imagery basemap
**Future work:**